The TI-84 Evo doesn't have an absolute value key, but it graphs absolute value functions just fine once you know where the abs( command is hiding: it's inside the MATH menu.
Graph an absolute value function
For this walk-through we'll graph y = |x − 3| + 1.
- Open the Y= list. Press
y=at the top left. This is the list of functions the calculator draws. If graphing is new to you, the full walk-through is in how to graph a function on the TI-84 Evo. - Grab the abs( command. Press
math, arrow right once to the NUM tab, and pick 1:abs(. A pair of absolute value bars appears on the Y1 line, with the cursor sitting between them.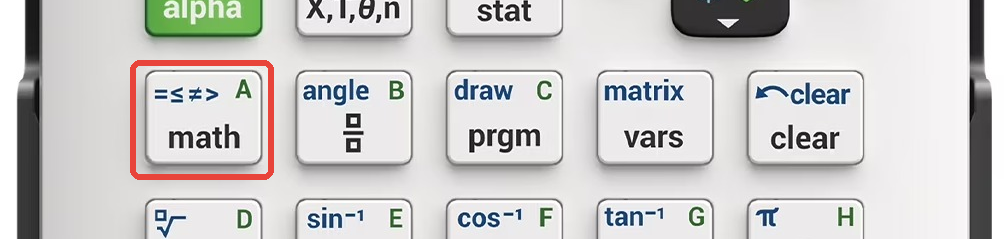
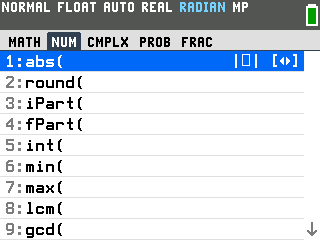
- Type what goes inside the bars. Press the X key (just to the right of
alpha), then−and 3. Everything you type lands between the bars.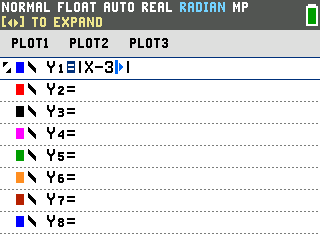
- Step out of the bars with the right arrow. Press
▶(the right arrow), and the cursor hops outside the bars. Then type +1 to finish the function.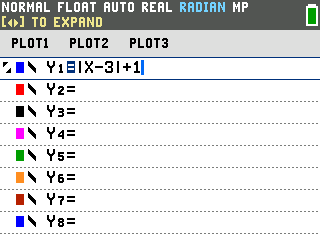
- Press
graph. There's the V. If yours matches, the entry went in right: the point of the V sits at (3, 1).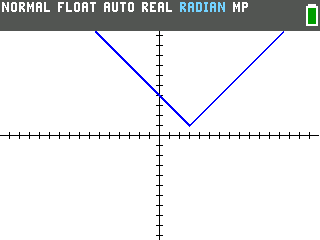
Good to know
- Skip the menu with the catalog. Press
2ndthen0for the CATALOG, an alphabetical list of every command. abs( is the very first entry, so2nd0enterdrops it in without any arrowing. - A leading negative uses the
(-)key. For a function that starts with a negative, like −2|x|, the sign in front is the(-)negative key on the bottom row, not the−subtraction key. Starting a function with the subtraction key gives ERROR: SYNTAX. - Reading the V's point. The calculator can pin the exact coordinates of the V's point: it's the minimum of an upward V (or the maximum of a flipped one), in the same CALCULATE menu covered in how to find intercepts on the TI-84 Evo.
- Read off exact points. To see the coordinates the V passes through as a column of numbers, see how to make a table of values on the TI-84 Evo.