The TI-84 Evo can turn any function into a table of X and Y values, so you can read exact outputs straight off the screen instead of working them out one at a time.
Make a table
- Enter a function. Press
Y=(top-left) to open the function editor, then type your function on the Y1 line. Wherever you need an X, press the X key just right ofalpha. For a parabola, press the X key then thex²key so the line reads Y1=X².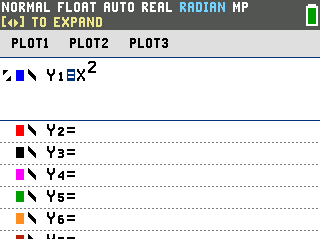
- Open the table. Press
2ndthengraph(the blue label above the graph key is TABLE). The calculator lists a column of X values with what each function gives back beside it. Press the up and down arrows to run the X column further in either direction.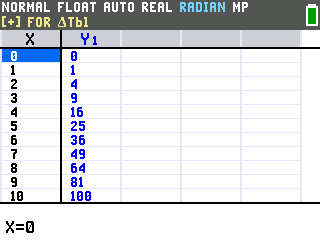
Set the start value and the step size
By default the table starts at X = 0 and counts up by 1. To change that, press 2nd
then window (TBLSET above the window key) to open TABLE SETUP.
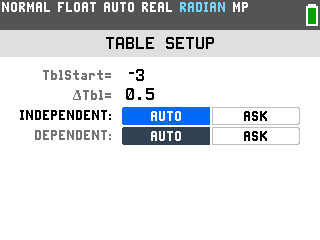
TblStart is the first X value in the table and ΔTbl is how far
X jumps between rows.
The cursor starts on TblStart: type a value, press enter to drop to the next line, and
type the step size. Here TblStart is set to -3 and ΔTbl to 0.5:
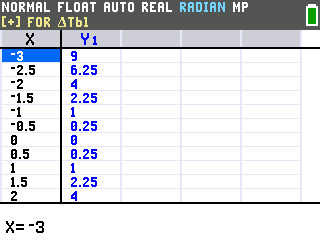
Open the table again and it starts at -3, counting up by halves:
Type your own X values
When you only care about a few specific inputs, you don't have to scroll a whole column to find them.
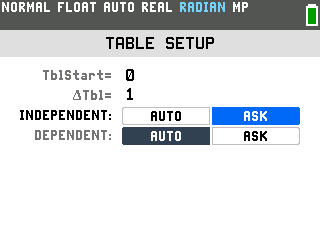
In TABLE SETUP, arrow down to the INDEPENDENT row and set it to
ASK (arrow right to ASK, then enter):
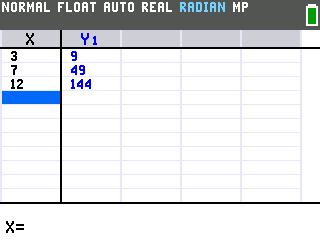
Now the table opens empty. Type any X value, press enter, and the calculator fills in
the result. Here X = 3, 7, and 12 give 9, 49, and 144 for Y1 = X²:
Good to know
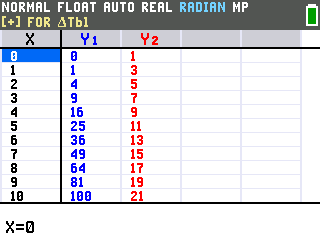
- Several functions at once. Fill in Y2, Y3, and
so on in the editor and the table gives each one its own column, colored to match its graph.
- Change the step size from the table. While the table is open, press
+to pop up a ΔTbl box and set a new step size without going back to TABLE SETUP. - The table follows the editor. Whatever you put in the Y= editor is what the table shows, so editing the function updates the table. It doesn't change your graph, it's just a second way to read the same function. If you also want to see it plotted, see how to graph a function on the TI-84 Evo.