The TI-84 Evo can tell you exactly where a graph crosses each axis, down to the coordinates, instead of leaving you to read them off the picture. The work happens in the CALCULATE menu: one command reads the y-intercept, another hunts down every x-intercept.
Start with a graph on the screen
You need the function graphed before you can find its intercepts. For this walk-through we'll use
Y1 = X² − X − 6: type it into the Y= list and press graph.
If entering and drawing a function is new to you, the full walk-through is in
how to graph a function on the TI-84 Evo.
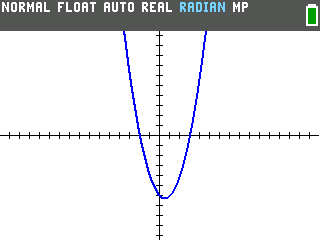
You can see the curve cross the y-axis once and the x-axis twice.
Find the y-intercept
The y-intercept is where the curve crosses the y-axis, and that always happens where x is 0. So finding it just means asking the calculator for the height of the graph at x = 0.
- Open the CALCULATE menu. Press
2ndthentrace(the blue CALC label sits above the trace key). The menu lists the things the Evo can measure on a graph.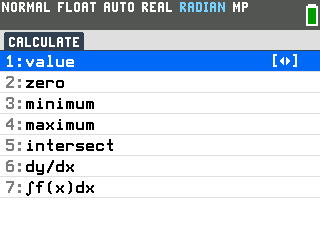
- Choose 1: value and enter 0. The graph comes back with an X=
prompt at the bottom. Type 0 and press
enter. The cursor jumps to the point where the curve meets the y-axis and shows X=0, Y=−6, so the y-intercept is (0, −6).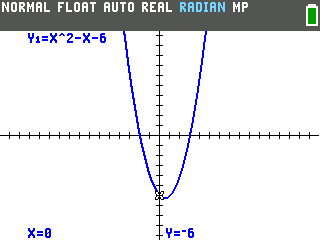
Find the x-intercepts
The x-intercepts are where the curve crosses the x-axis, where y is 0. You may also hear them called the zeros or the roots. The Evo finds them with the zero command, one at a time.
- Open CALCULATE again and choose 2: zero. Press
2ndthentrace, arrow down to zero, and pressenter. The status bar reads Left Bound?: a graph can cross the axis more than once (this one does it twice), so you fence in the intercept you want, starting with a spot on its left. - Walk the cursor past the left x-intercept. Hold down the left arrow (or tap it) to
slide the cursor along the curve; the X= readout at the bottom updates as you go. Stop
once the cursor sits just left of the intercept (around x = −2.1 here) and press
enter.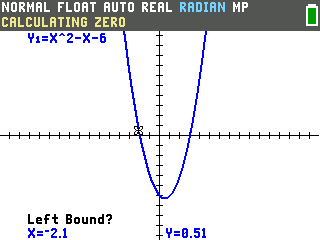
- Set the right bound and confirm. At Right Bound?, arrow back a few
presses so the cursor sits on the other side of the intercept and press
enter. At Guess? pressenteronce more, and the Evo lands exactly on X=−2, Y=0.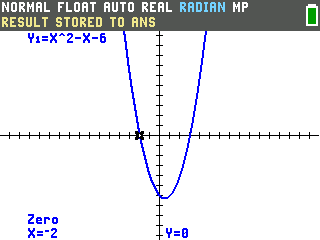
- Do the same for the right x-intercept, with a shortcut. At any bound prompt you can
type an x-value instead of arrowing, and the cursor jumps straight there. From the graph you can tell
this one sits somewhere between x = 0 and x = 5, so run zero again, type 0 and
press
enterfor the left bound, then 5 andenterfor the right bound, and pressenteronce more. This time the answer is X=3, Y=0. The two x-intercepts are (−2, 0) and (3, 0).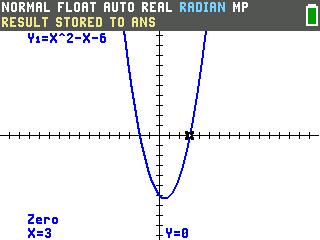
Good to know
- Bracket one intercept at a time. A parabola can meet the x-axis twice, once, or not at all, and zero only reports the one inside your bounds. Any value between the two intercepts, like the 0 we used here, works as the inner edge for both of them.
- Every answer lands in Ans. The status bar says the result was stored to Ans, so you can
pull the last intercept straight into another calculation with
2ndthen(-). - The same menu finds the vertex. Where zero and value live, so do minimum and maximum. Bracketing the dip of this parabola with minimum returns its turning point, (0.5, −6.25).
- Prefer a table? If you'd rather read an intercept off a column of numbers, see how to make a table of values on the TI-84 Evo.