Everything graphing-related on the TI-84 Evo lives on the five keys along the top row.
Graph a function
- Press
Y=. It's the top-left key, and it opens the function editor with the cursor sitting on Y1.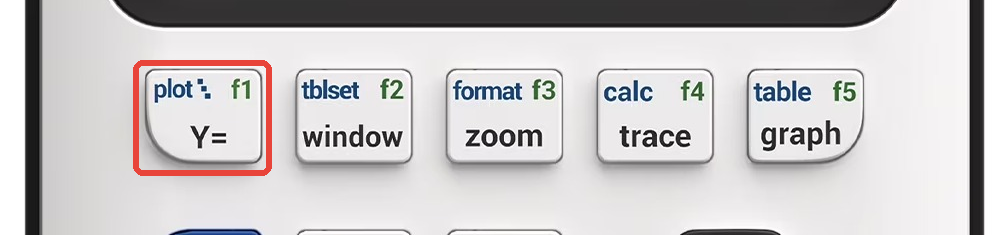
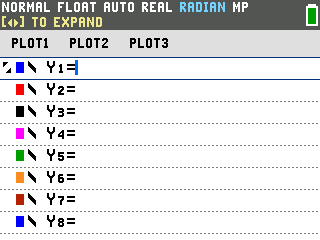
- Type your function. Whenever you need an X, press the X key
just right of
alpha. For a parabola, press the X key then thex²key so the line reads Y1=X².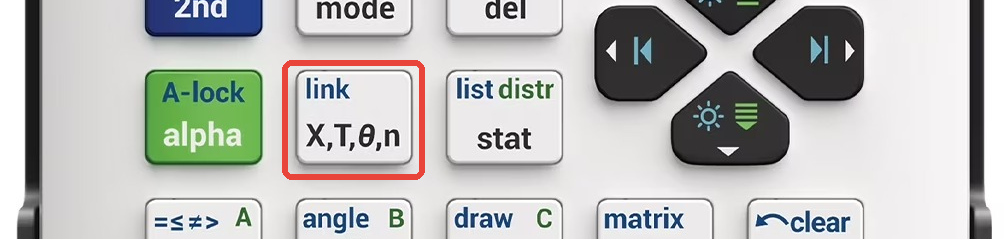
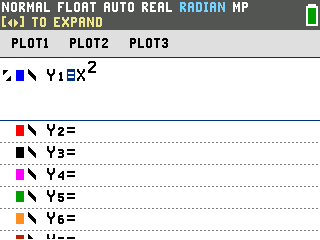
- Press
graph. It's the top-right key, and the calculator draws your curve.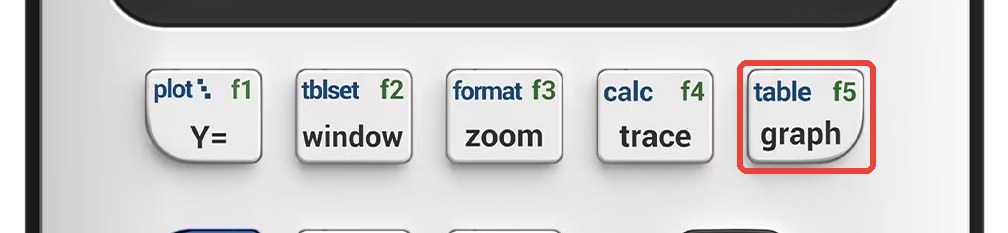
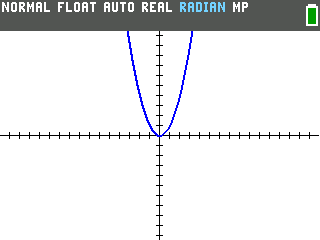
One thing to know: the graph screen shows a fixed slice of the coordinate plane, and it doesn't adapt to your function. Graph Y1=X+100 and you'll get an empty screen, because that line never passes through the visible area. Picking the view is what the window section below is for.
Trace along the curve
Press trace to drop a cursor onto the curve. The X and Y readout at the bottom
updates as you press the left and right arrows, so you can read the value at any point. The Evo's
trace also stops on points of interest and labels them, so it lands on the y-intercept first.
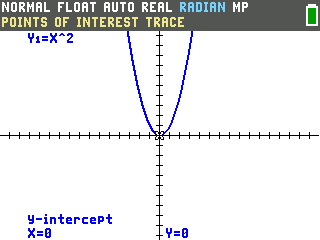
The arrows move one pixel at a time, so for anything farther away just type where you want to go:
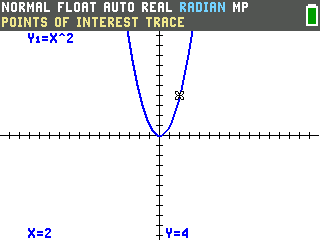
type a number while tracing, press enter, and the cursor jumps straight to that x. Typing
2 on this parabola lands the cursor on (2, 4).
Set the viewing window
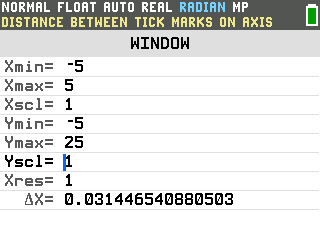
Press window to choose exactly which part of the plane the graph shows.
Xmin and Xmax are the left and right edges of the picture,
Ymin and Ymax the bottom and top. The cursor starts on Xmin: type a
value (it replaces the old one) and press enter to hop down to the next line. Here the
window is set to show x from -5 to 5 and y from -5 up to 25:
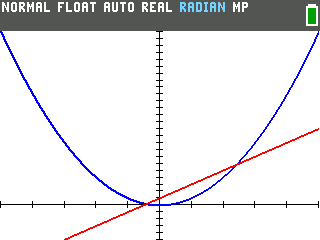
Press graph and it draws exactly that box. With Ymax at 25, the arc of the parabola
is in view all the way up to y=25:
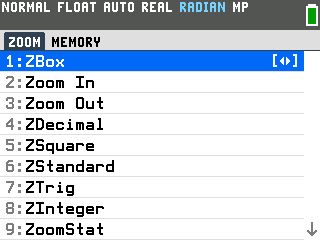
To get a normal view back without retyping anything, press zoom and pick
6:ZStandard. It resets the graph to a standard view. The same menu has
Zoom In and Zoom Out if you just want to step closer or back.
Good to know
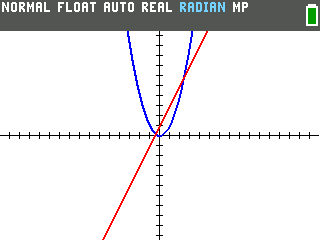
- Graph several at once. Fill in Y2, Y3, and so
on in the same editor. They all plot together, each in the color shown next to its line.
- See a table instead. Press
2ndthengraphand the calculator lists X values with what each function gives back, in the same colors as the curves.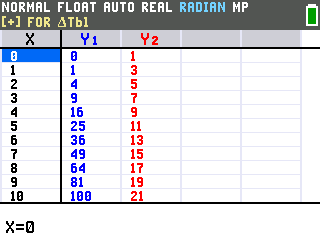
- Nothing shows up? Make sure you used the X key for every X in the function. If the line still doesn't appear, it's probably outside the current view, like the Y1=X+100 example above: set the window to where the function actually lives.