The TI-84 Evo plots a set of points as a scatter plot, reading the x-values from one list and the y-values from another.
Plot a set of points
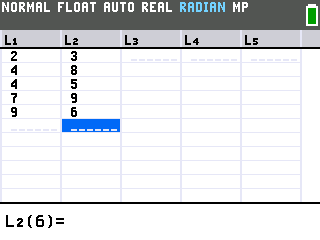
We'll plot five points: (2, 3), (4, 8), (4, 5), (7, 9), and (9, 6). The x-values don't have to be in order or evenly spaced, and two points can share an x-value.
- Open the list editor. Press
stat, thenenterto choose 1:Edit. If the lists already have numbers from a previous problem, clear them first (see Clear a list below).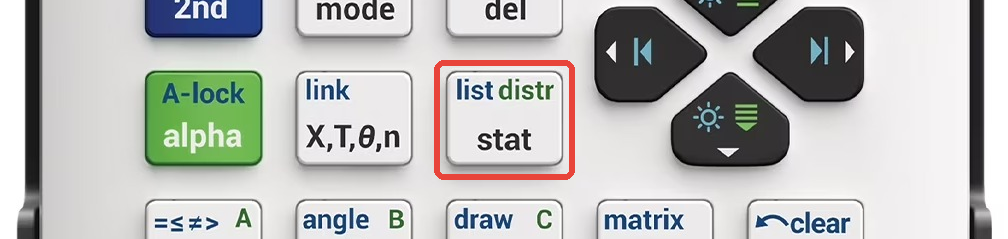
- Type the x-values down L1, pressing
enterafter each: 2, 4, 4, 7, 9. - Type the y-values down L2. Press the right arrow to jump to the top of L2, then
enter each point's y-value next to its x: 3, 8, 5, 9, 6. Each row now holds one point, so the first
point (2, 3) sits in row one.
- Turn on a scatter plot. Press
2ndtheny=to open STAT PLOTS, choose Plot1, and pressenterto turn it On. The scatter type and the L1/L2 lists are already set by default.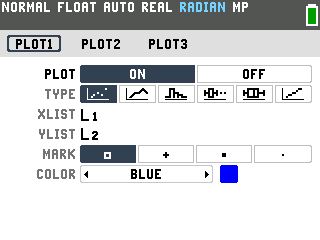
- Frame the points with ZoomStat. Press
zoomand choose 9:ZoomStat. It sets the window to fit your data, so every point shows on screen. (Pressinggraphinstead uses whatever window you had, which may not be centered on your points.)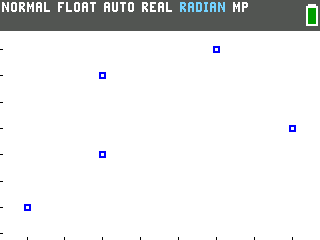
- Read a point with trace. Press
trace. The first point's coordinates show at the bottom (X=2, Y=3), and the right and left arrows hop from point to point.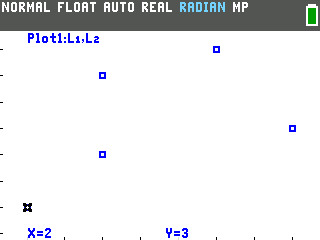
Good to know
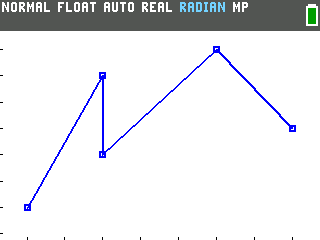
- Connect the points into a line. Back on the Plot1 setup screen, move down to
Type and pick the second icon instead of the scatter. Now ZoomStat draws a line from point to
point in the order you entered them, which is what you want for a line graph of data.
- Clear a list to start over. In the list editor, arrow up onto the list's name at the very
top of the column, press
clear, thenenter. The whole column empties, and the list itself stays put for new numbers. - A stray line through your points. If a line runs through your scatter, an old equation is
still sitting in the
y=list and drawing over the plot. Pressy=, move to that line, pressclearto delete it, then graph again and only your points remain. - Turn the plot off when you're done. A stat plot keeps drawing over whatever you graph
next, so its dots can show up on an unrelated function. Press
2ndtheny=, choose 4:PlotsOff, and pressenterto switch every plot off. - New to graphing? The basics of the graph screen and window are in how to graph a function on the TI-84 Evo, and if you'd rather read your values as a column than as dots, see how to make a table of values.
- Fit a line through your points. Once your scatter is on screen, the Evo can find its best-fit line and draw it through the data: see how to do linear regression on the TI-84 Evo.