The TI-84 Evo can fit a straight line to a set of data points and give you its equation, along with a number that tells you how closely the line matches. It does the whole job with one command, LinReg(ax+b).
As an example, say five students tracked how many hours they studied and the score they earned:
| Hours studied (x) | 1 | 2.5 | 2.5 | 4 | 5 |
|---|---|---|---|---|---|
| Test score (y) | 55 | 70 | 65 | 83 | 90 |
Two of the students studied the same 2.5 hours and scored differently. That's fine: x-values can repeat, and they don't have to be whole numbers or evenly spaced.
Enter the data in two lists
- Open the list editor. Press
stat, thenenterto choose 1:Edit. Each column is a list. You will put the x-values in L1 and the y-values in L2. - Type the two columns. With the cursor at the top of L1, enter
each x-value and press
enterafter it: 1, 2.5, 2.5, 4, 5. Then arrow right to the top of L2 and enter the y-values the same way: 55, 70, 65, 83, 90.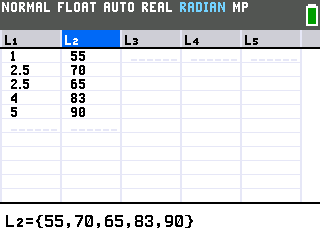
Run the regression
- Open LinReg. Press
statand arrow right to the CALC tab, then choose 4: LinReg(ax+b).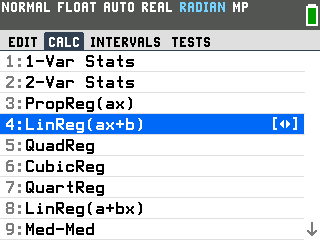
- Run it. A setup screen opens with XLIST already on L1 and
YLIST on L2, which is exactly what you want. Press
zoomto run it. The CALCULATE button at the bottom of the screen sits directly above thezoomkey.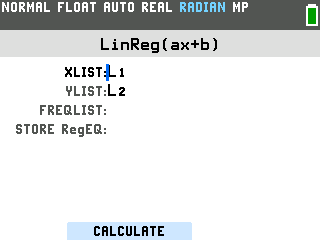
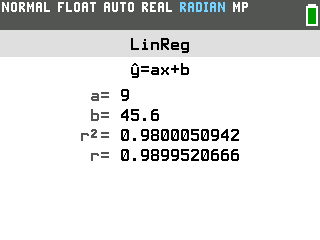
The Evo returns the best-fit line and its statistics:
Read the results
- a is the slope, b is the y-intercept: the line for this data is y = 9x + 45.6.
- r and r² measure the fit. The closer they sit to 1, the tighter the line matches the points; here r is about 0.99, a very close fit.
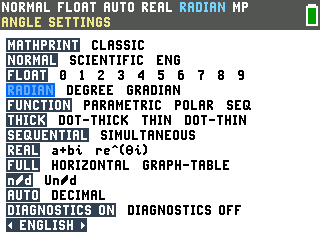
- No r or r² on your screen? Diagnostics is off: press
mode, move down to DIAGNOSTICS, and choose On. The Evo ships with it on.
Good to know
- Save the equation to graph it. Want the line drawn on a graph? On the LinReg
setup screen, before you press
zoom, move down to STORE RegEQ and pressvars, arrow to Y-VARS, then choose 1: Function and 1: Y1. Now when you run it, the best-fit equation also lands in Y1, ready to graph. - LinReg(ax+b) or LinReg(a+bx)? Both sit in the CALC tab and fit the same line. They only differ in which coefficient is labeled a and which is b. Option 4 writes the result as y = ax + b, the form most classes use.
- The result does not update on its own. Change a value in L1 or L2 and the old a, b, and r stay put until you run LinReg again. Rerun it whenever the data changes.
- Predicting a value. Once the equation is in Y1, you can read predictions off it for any x. See how to make a table of values on the TI-84 Evo to get exact outputs without doing the arithmetic by hand.
- Just want the points, no line? Plotting a scatter on its own is a quicker job: see how to plot points on the TI-84 Evo.
- r can be negative. The sign only tells you the line's direction: a perfect downhill fit has r = −1. It's the distance from 0 that measures strength.