The TI-84 Evo graphs inequalities with a built-in app called Inequality Graphing, one of the icons
on the grid that opens when you press on. Type each inequality and the app shades its
solutions, and when you graph a whole system it can shade just the region where everything
overlaps.
Open the Inequality Graphing app
- Press
onfor the app grid, and arrow onto the shaded-triangles icon. The bar along the top names whatever is highlighted, so it reads INEQUALITY GRAPHING when you have the right one. If the icon is missing from your grid, a full memory reset has removed it along with the other built-in apps, and restoring your missing apps brings it back.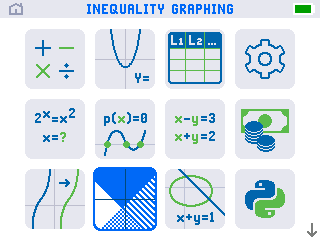
- Press
enterto open it. A reminder box pops up pointing at the app's inequality menu, which comes up later in this guide, so pressenteragain to close it. You land on a list of lines from Y1 to Y8 that works just like the editor for ordinary graphing, with a color square in front of each line.
Type the first inequality
The example system here is y ≤ x + 2 and y > −x + 4. Everything works like typing a normal function except one move: the = sign becomes an inequality symbol through a pop-up box.
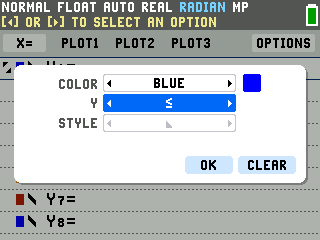
- Press the left arrow twice to select Y1's line options. The first press puts
the cursor on the = sign, and the second highlights the whole front of the line, color square and
all, with [enter] TO MODIFY in the status bar. Press
enterand the settings box pops up. - Pick ≤ on the middle row. Arrow down to the row showing the = sign, then
arrow right until it shows ≤. The STYLE row underneath previews which side of
the line will shade.
- Select OK, then type the right side. Arrow down to OK and press
enter, then arrow right back onto the line and type X + 2, using the X key just to the right ofalpha.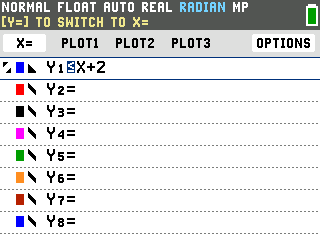
- Press
graph. The boundary line draws solid, because ≤ keeps the points on the line, and the whole region below it fills in blue. Every shaded point is a solution of y ≤ x + 2.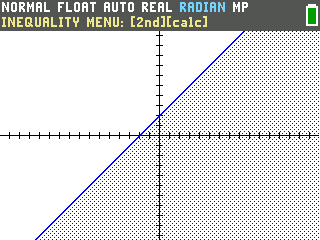
Make it a system
- Press
y=to come back to the editor. Then set up the second line the same way: arrow down to Y2, press the left arrow twice to select its options, and pressenter. - Pick > this time, select OK, and type −X + 4. Use the
(-)negative key on the bottom row for the sign in front of X.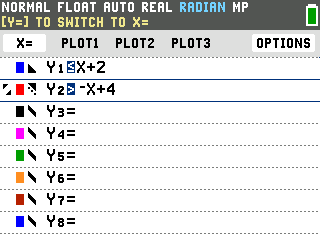
- Press
graph. The new boundary comes out dashed, because > is strict and points on the line itself don't count, and the red shading sits above it. The system's solutions are the region where the two shadings overlap.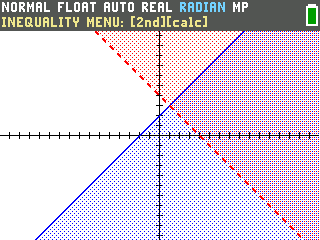
Shade just the solution region
On a crowded window the overlap can be hard to pick out, so the app has a view that shades only the solution region. It lives in the menu the opening reminder pointed at.
- Press
2nd, thentrace. The blue calc label abovetraceis the menu the app calls [2nd][calc]. It opens on a CALCULATE tab, so arrow right to the INEQUALITY tab.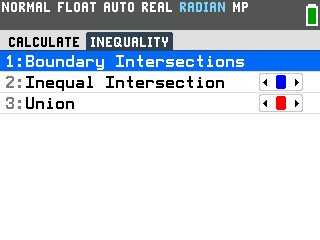
- Scroll down to 2:Inequal Intersection and press
enter. The graph redraws with only the overlap shaded. Every point in that region satisfies both inequalities at once.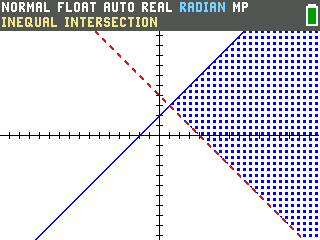
- Mark the corner with 1:Boundary Intersections. Open the same menu again
(
2nd, thentrace, then arrow right) and pressenteron the first item. The point where the boundary lines cross gets a marker, and its coordinates print along the bottom of the screen: X=1 and Y=3.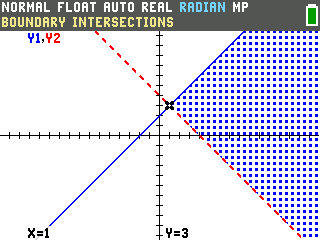
Vertical inequalities like x < 3
The regular graphing editor can't draw x < 3, because there is no y in it. This app can.
Inside the editor, press y= and the list flips from Y lines to X lines. Set X1's symbol
to < through the same pop-up box, then type 3:
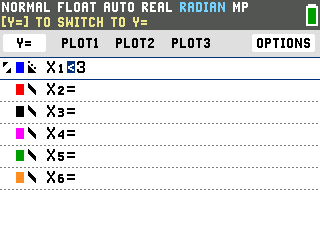
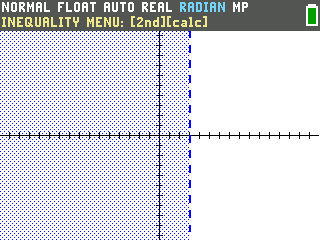
Press graph and you get a dashed vertical line at x = 3 with everything to its left
shaded. Press y= again to flip back to the Y side.
Good to know
- The special views stick. Inequal Intersection and Union stay on for every new
graph until you quit the app and open it again. To quit, arrow up past Y1 to the row of tabs,
arrow across to OPTIONS, press
enter, and choose Quit App. Your inequalities are still in the editor when you come back. - Union is the other combined view. Choosing 3:Union in the same menu shades every point that satisfies at least one of the inequalities instead of all of them.