Graphing a trig function on the TI-84 Evo is like graphing anything else, but the viewing window and the angle mode are what decide whether the wave actually looks right.
Graph a sine wave
- Press
Y=. It's the top-left key, and it opens the function editor with the cursor on Y1. - Type the function. Press
sin, then the X key just right ofalpha, so the line reads Y1=sin(X. You don't need to close the parenthesis.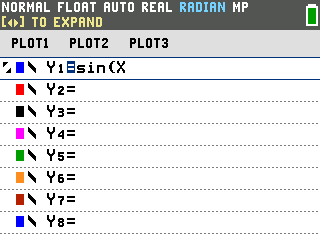
- Press
graph. The wave draws, but on the standard window it's squeezed into a thin band across the middle.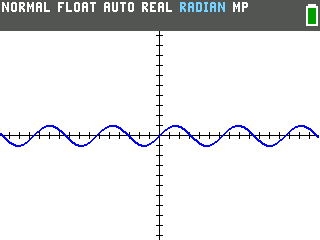
The fast way: ZTrig
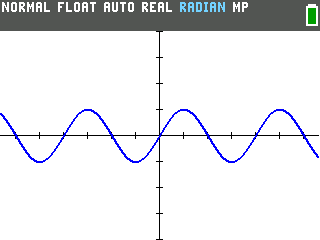
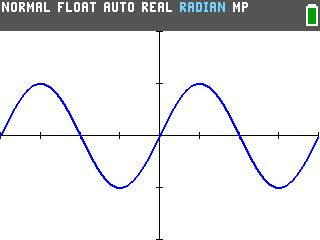
Press zoom and choose 7:ZTrig. In one press it sizes the window to a
wave and matches your angle mode, so the sine curve fills the screen. The tick marks along the x-axis
are now π/2 apart, a quarter turn each.
Set the window yourself
ZTrig always gives the same fixed frame. To choose your own view, press window and set
the edges by hand.
For X, a couple of full waves reads well. Set Xmin to -2π and Xmax
to 2π. You can type π right in the window as 2nd then ÷, and the
calculator turns it into a decimal.
Leave the scale at π/2 so a tick mark lands on each quarter turn, and set Y from -2 to 2, enough room for a wave that only reaches 1.
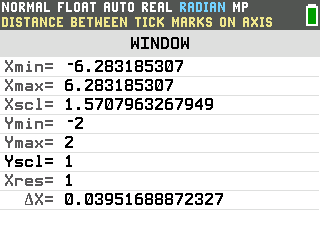
Press graph for exactly two clean periods, framed the way you chose.
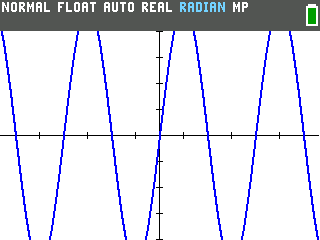
Choosing Y yourself matters most for taller waves. Graph something like 5sin(X), and ZTrig's fixed height cuts the peaks off:
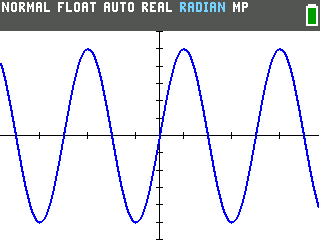
Give Ymin and Ymax room past the top of the wave, like -6 and 6, and it fits.
Radians or degrees
The calculator draws in whatever angle mode it's set to, and it starts in radians. If your wave looks flat or scrambled, the mode and the window don't match:
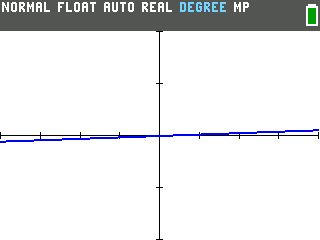
Switch the mode in the mode menu (here's how to switch
between degree and radian mode), then press ZTrig again and the graph reframes to fit the mode
you're in.
Good to know
- Tangent looks different. Graph
tan(X)the same way. It draws as steep branches with vertical gaps between them, not a smooth wave.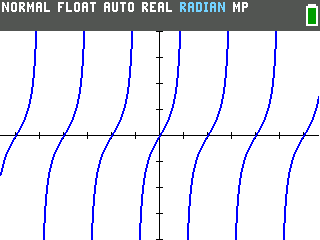
- Cosine works just like sine. Enter
cos(X)on any Y line and it graphs the same way. - No secant, cosecant, or cotangent key. The keyboard only has sin, cos, and tan, so
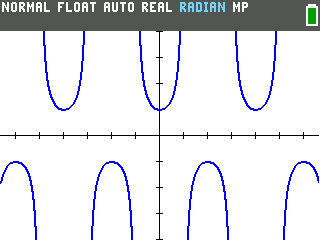
build the other three as fractions: secant is 1÷cos(X), cosecant is
1÷sin(X), and cotangent is 1÷tan(X). Here's secant
entered that way.
- The rest of the graphing keys work here too. Trace, zoom, and the window fields behave the same as with any graph. See how to graph a function for those.