How to Adjust the Graphing Window on the TI-84 Evo
The window decides how much of a graph the TI-84 Evo's screen shows, and you can set each of its four edges yourself.
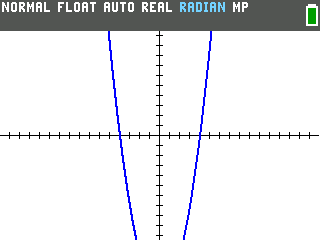
Here's the graph of Y1 = X² − 16 in the window the calculator starts with. The bottom of this
parabola is cut off. (New to graphing? Graphing a function on the TI-84 Evo covers typing it in.)
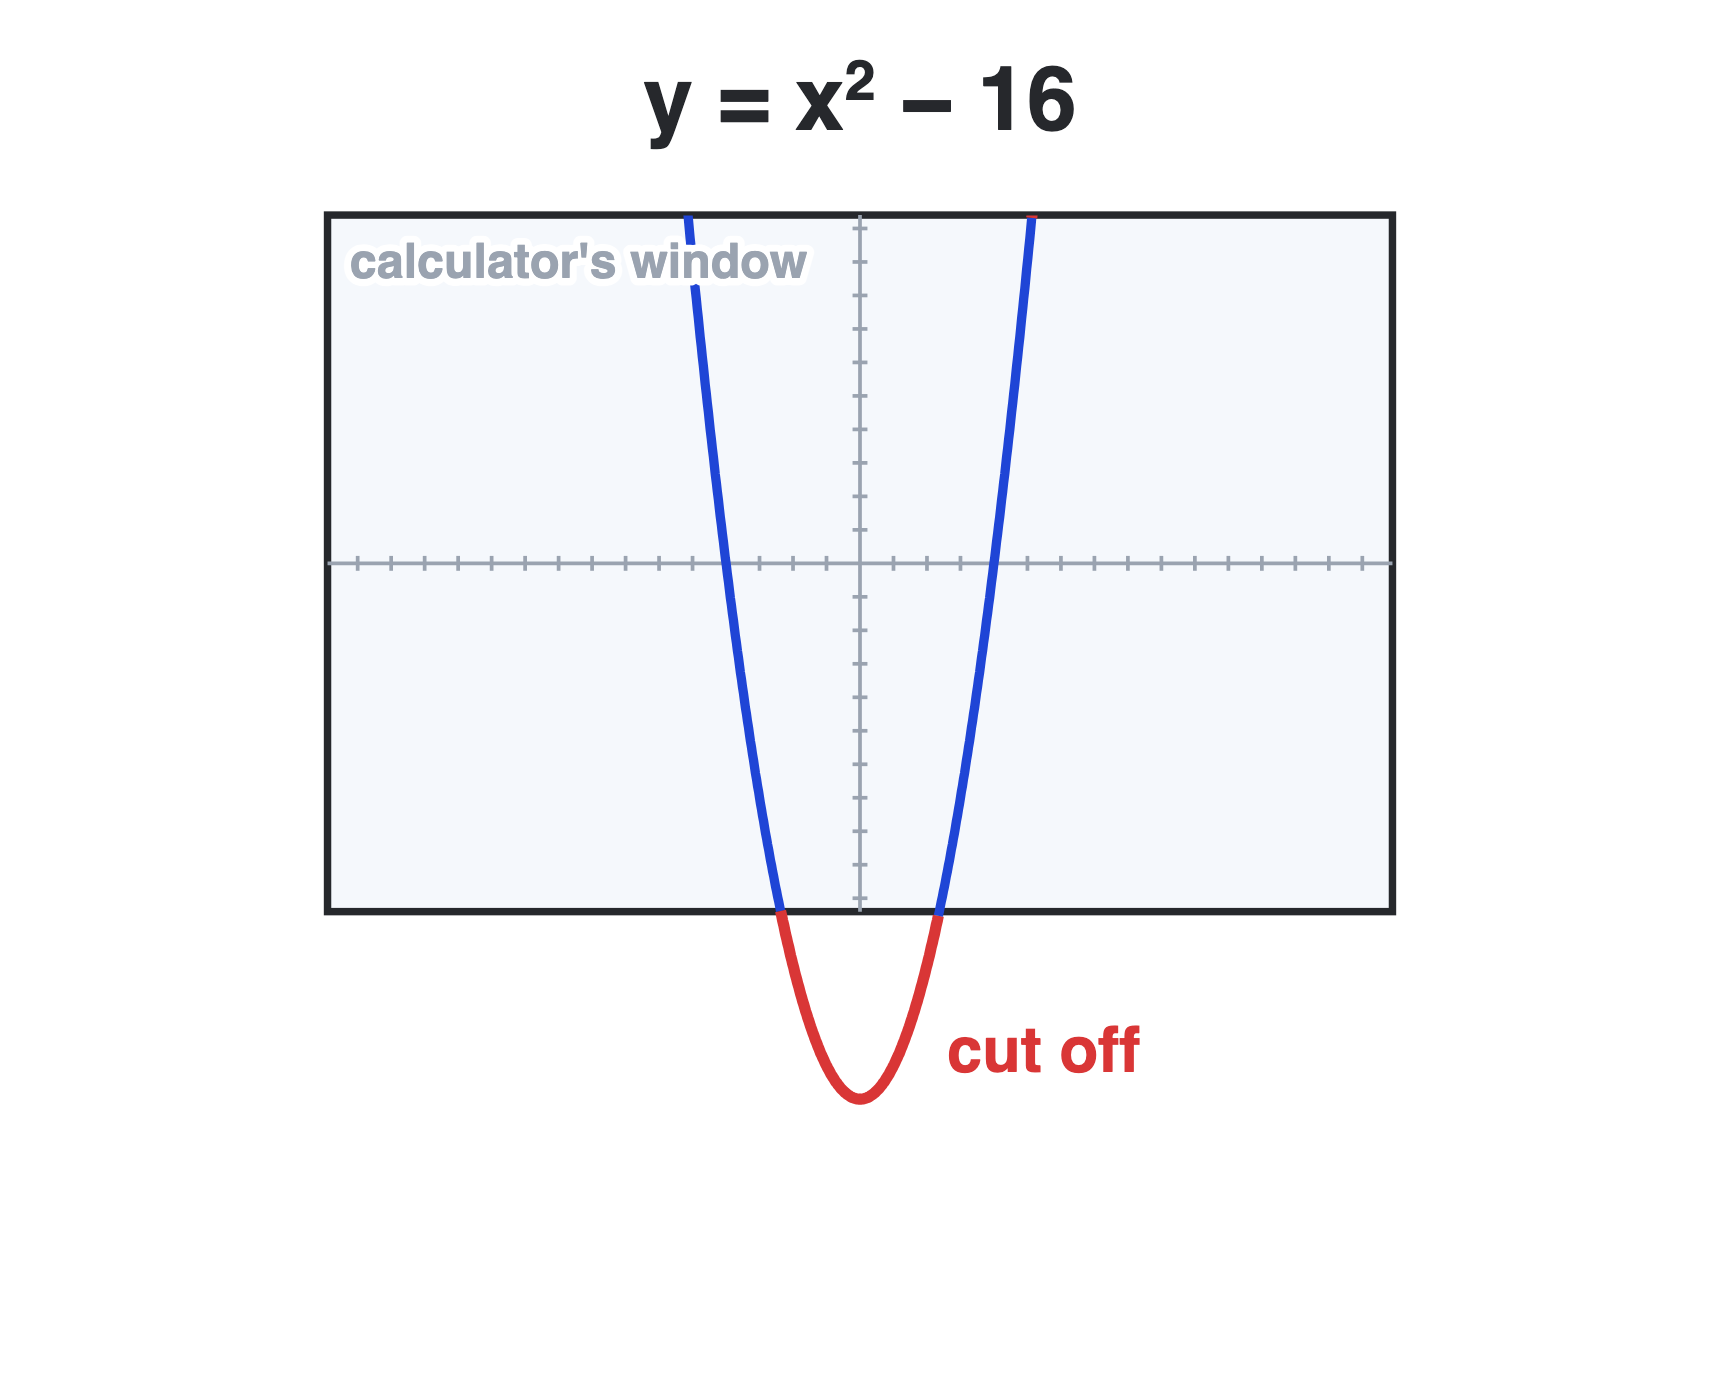
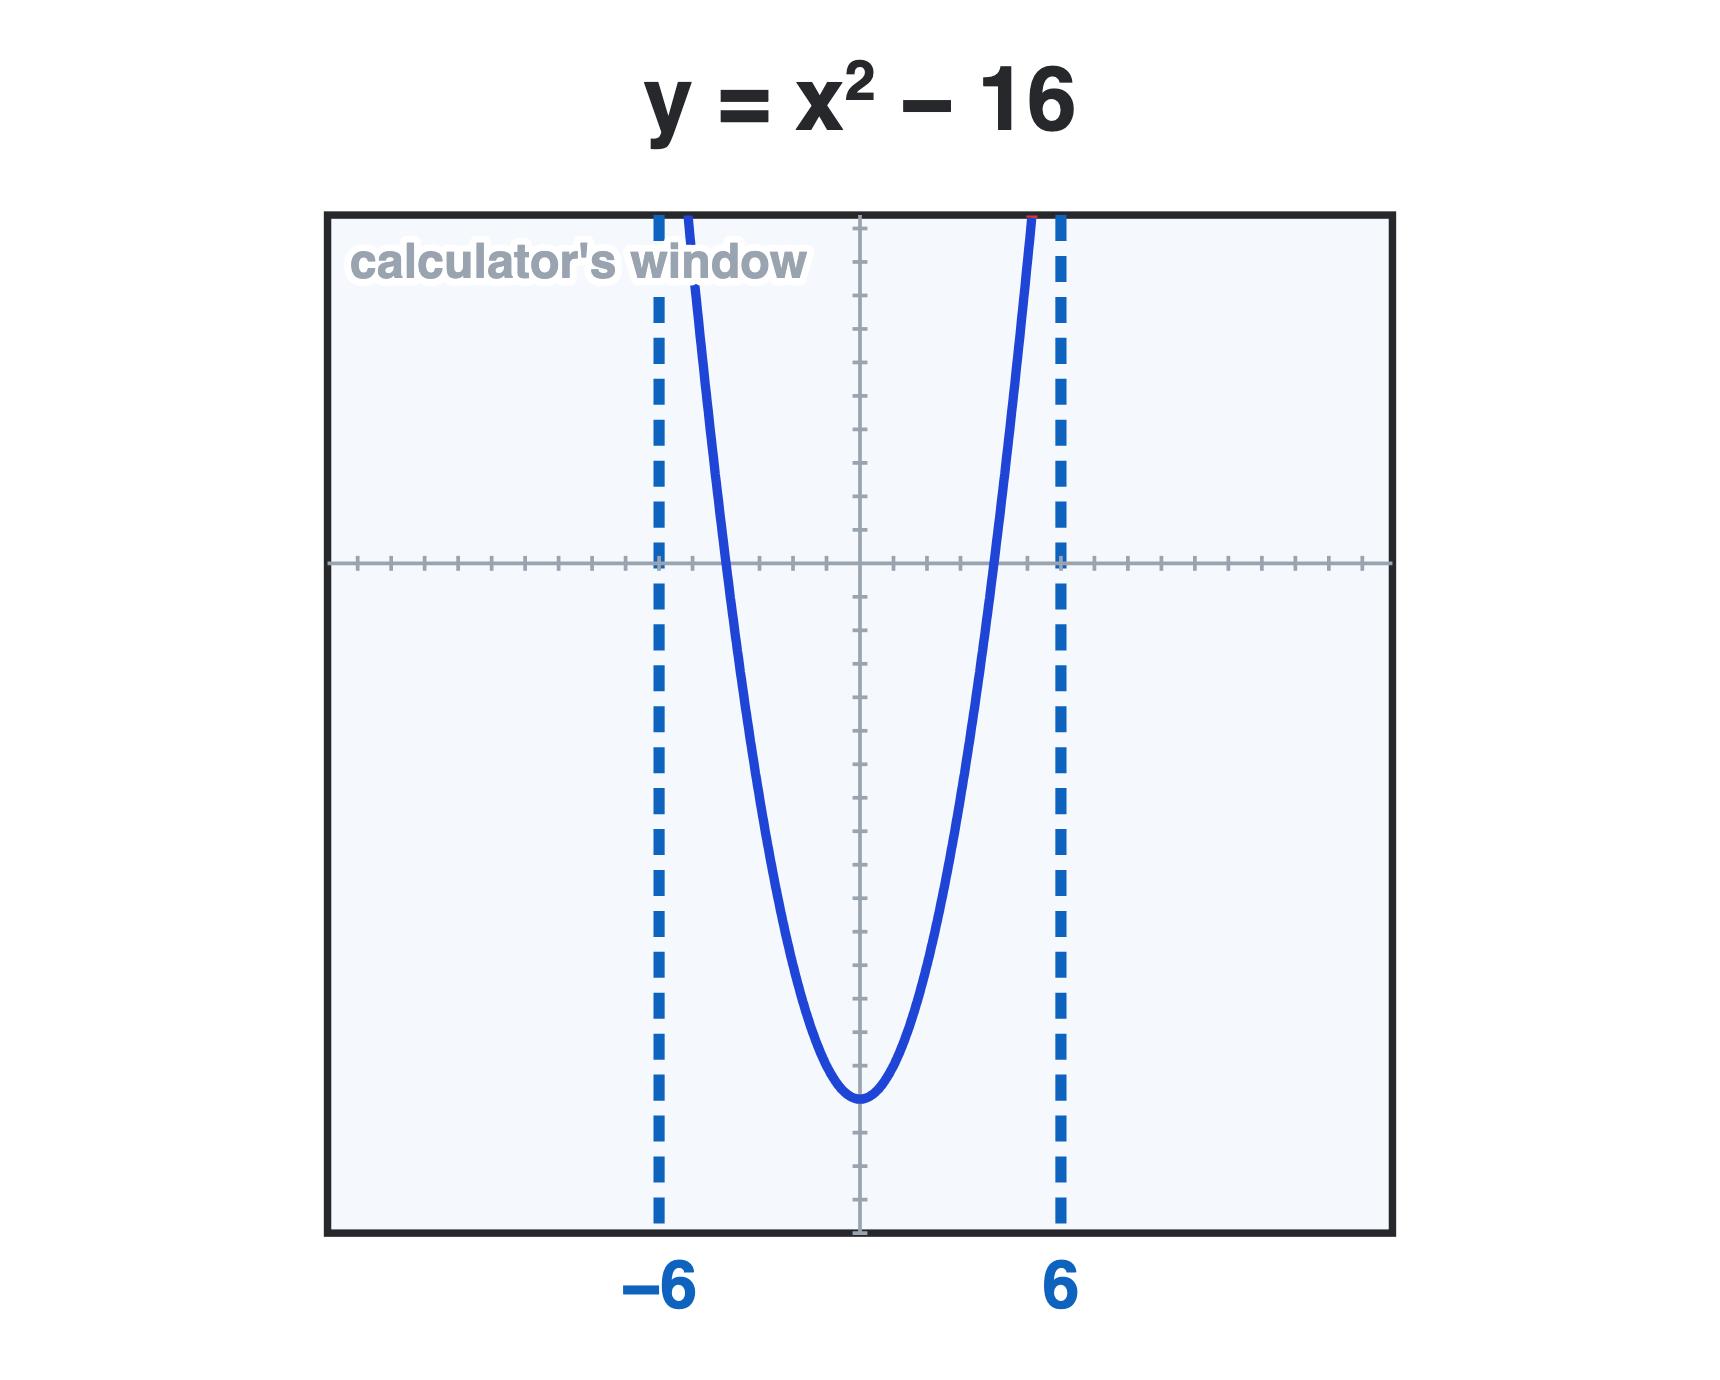
Drawn in full, with the calculator's window as a box, you can see the part that's missing:
Find how low the curve goes
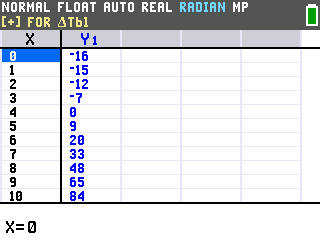
Press 2nd, then graph. TABLE is the blue label above the graph
key. It lists X values down the left and what the function gives back for each one, starting at X = 0.
The bottom of this parabola sits on the y-axis, where x is 0, and the table shows y = −16
there. So the bottom of the window needs to sit a little lower than that. −20 works.
Move the bottom of the window
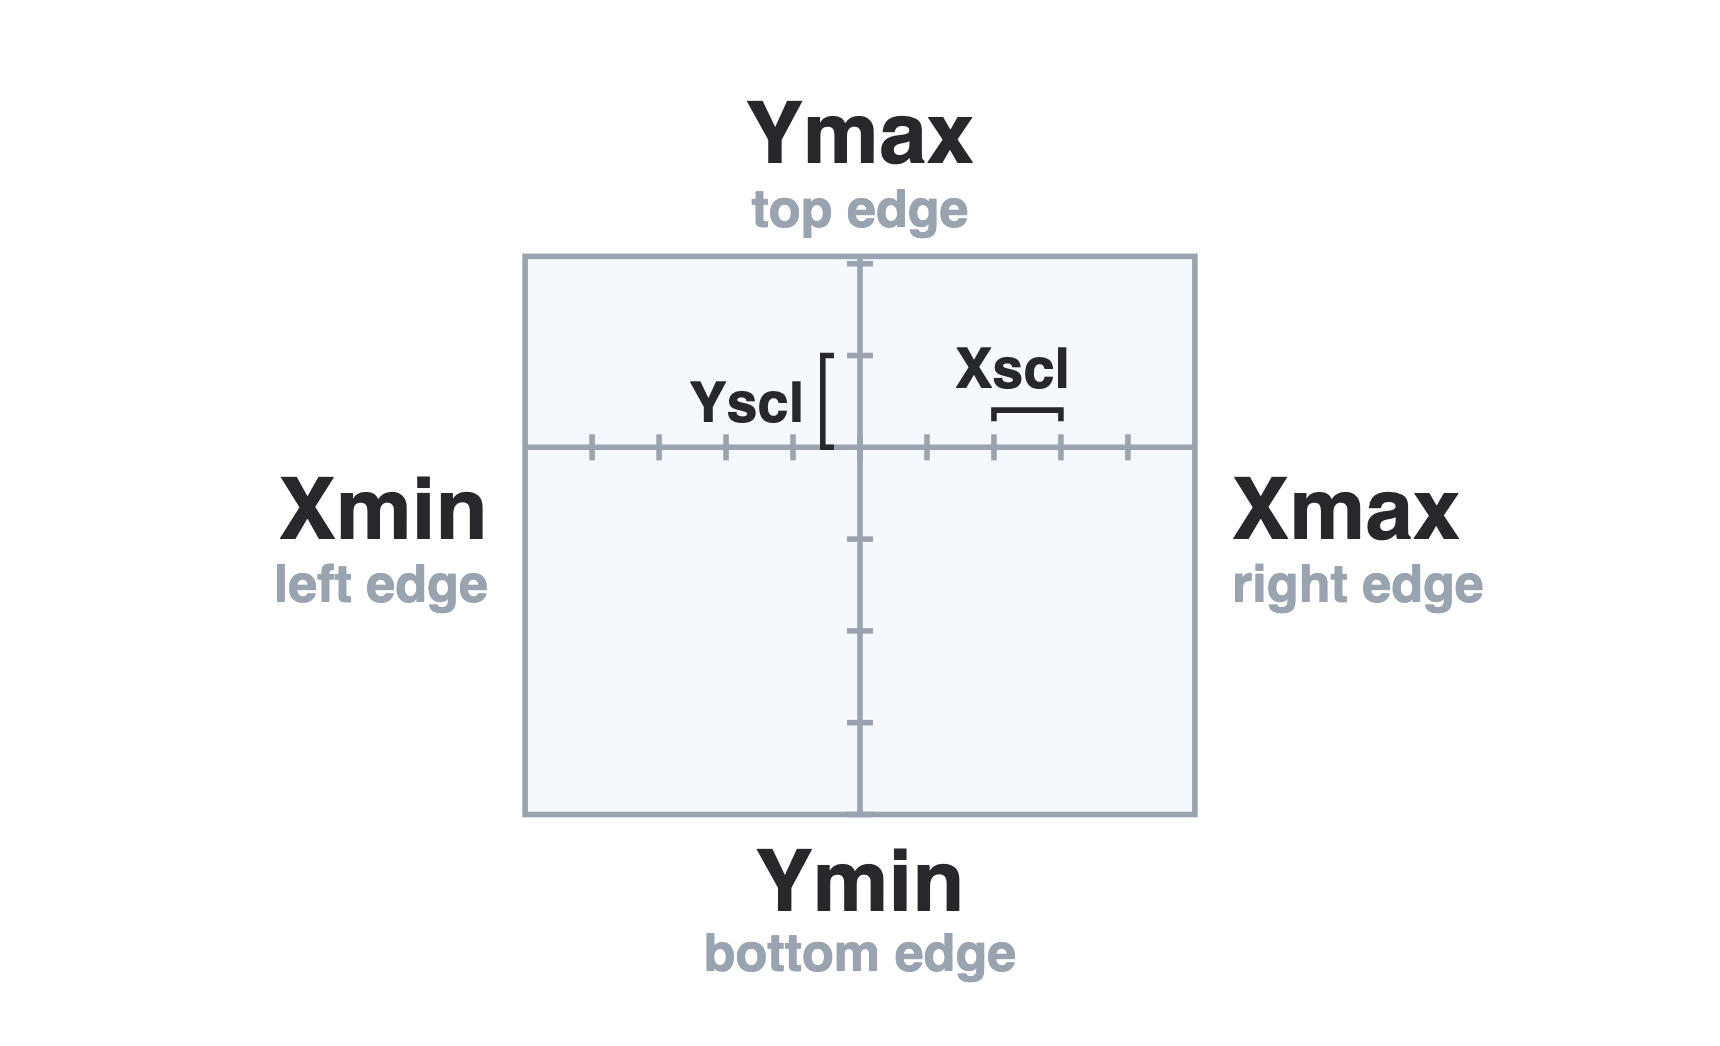
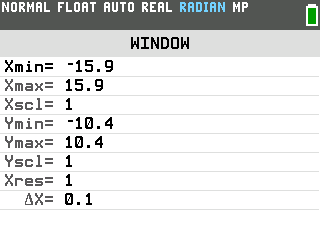
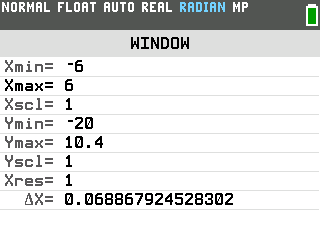
Here is what each WINDOW setting controls:
Press window. It's the second key on the top row.
The WINDOW screen opens with the cursor on Xmin.
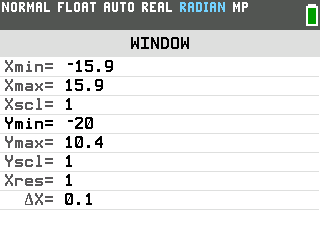
Press the down arrow until the cursor lands on Ymin. That's the bottom edge.
Type −20 and press enter. Make the minus sign with the
(−) key on the bottom row. What you type replaces the old value.
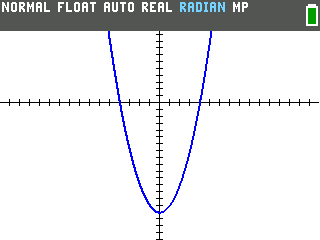
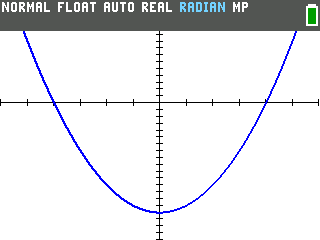
Press graph. Now the bottom of this parabola fits on the screen.
Spread the curve across the screen
There's still a lot of empty space on the left and right, though. Bringing Xmin and Xmax in closer makes it
fit better, and lines at x = −6 and 6 hug it nicely:
Press window again. The cursor starts on Xmin, the left edge.
Type −6 and press enter. The cursor moves down to Xmax.
Type 6 and press enter. That's the right edge.
Press graph. The curve spreads out to fill the screen, bottom and all.
Good to know
ERROR: SYNTAX after typing a negative edge? The subtract key was used instead of
(−). On the WINDOW screen the two signs look almost the same, but only the negative key
works. Choose 2:Go to to land back on the WINDOW screen and retype the number.
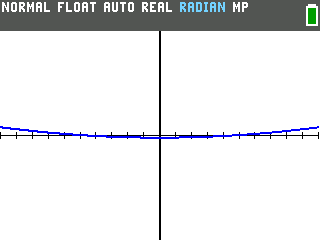
An axis that turns into a thick black bar means the scale is too small for the window.
Here the y-axis runs from −1000 to 1000 with Yscl left at 1, which asks for 2,000 tick marks. Raising
Yscl to 100 spaces them out again.
Back to the starting window: press zoom and choose 4. It's
called Zoom Default on OS 7.1 and ZDecimal before that, and both put the window back to where the calculator
started.
ΔX changes by itself. The calculator works it out from Xmin and Xmax, so the long
number at the bottom of the WINDOW screen updates on its own when you set a new window.